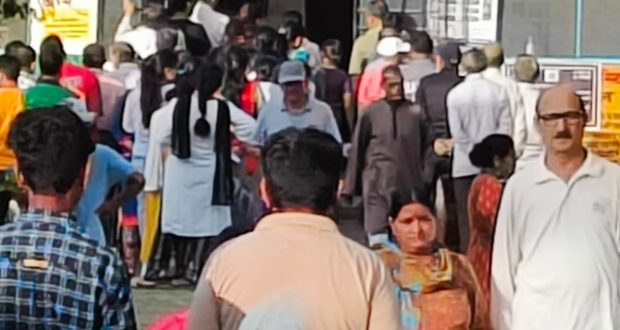
Phase 2 of the Lok Sabha elections, encompassing 88 seats, saw a voter turnout of 66.7%, which is approximately 3 percentage points lower than the turnout recorded in 2019. This decline occurred despite numerous appeals made by the Prime Minister during his rallies, efforts by the Bharatiya Janata Party (BJP) to motivate its cadre after Phase 1, and various measures undertaken by the Election Commission of India to boost voter participation, such as extending polling hours in certain constituencies.
There is a common belief that a higher voter turnout signifies a desire for change, while a lower turnout suggests a preference for continuity. However, analyzing data from 1951-52 to 2019 reveals that there is no straightforward correlation or consistent trend.
Over the span of 17 Lok Sabha elections, held from 1951-52 to 2019, voter turnout has fluctuated. Out of the 16 elections held between 1957 and 2019, there were six instances where the turnout declined, and 10 instances where it increased. Among the elections with increased turnout, the incumbent government lost four times and emerged victorious in six, resulting in a 60% repetition rate. Conversely, in elections with decreased turnout, the incumbent lost four times and won twice, indicating a repetition rate of 33%.
The BJP has led governments on five occasions: in 1996 (for 13 days), 1998 (for 13 months), 1999, 2014, and 2019. Notably, in four out of these five instances, except for 1999, elections saw higher turnouts. Therefore, 80% of the time the BJP has formed governments, it has been associated with increased polling percentages.
This data underscores the significance of higher voter turnout for the BJP. It reflects the party’s awareness of the importance of robust voter engagement. Following a lower turnout in Phase 1 of recent elections, the BJP publicly acknowledged and addressed the issue, demonstrating its proactive approach. While other parties likely conducted similar assessments, the BJP’s transparency in this regard stands out
 Dainik Nation News Portal


